Uptrick: Trend SMA Oscillator### In-Depth Analysis of the "Uptrick: Trend SMA Oscillator" Indicator
---
#### Introduction to the Indicator
The "Uptrick: Trend SMA Oscillator" is an advanced yet user-friendly technical analysis tool designed to help traders across all levels of experience identify and follow market trends with precision. This indicator builds upon the fundamental principles of the Simple Moving Average (SMA), a cornerstone of technical analysis, to deliver a clear, visually intuitive overlay on the price chart. Through its strategic use of color-coding and customizable parameters, the Uptrick: Trend SMA Oscillator provides traders with actionable insights into market dynamics, enhancing their ability to make informed trading decisions.
#### Core Concepts and Methodology
1. **Foundational Principle – Simple Moving Average (SMA):**
- The Simple Moving Average (SMA) is the heart of the Uptrick: Trend SMA Oscillator. The SMA is a widely-used technical indicator that calculates the average price of an asset over a specified number of periods. By smoothing out price data, the SMA helps to reduce the noise from short-term fluctuations, providing a clearer picture of the overall trend.
- In the Uptrick: Trend SMA Oscillator, two SMAs are employed:
- **Primary SMA (oscValue):** This is applied to the closing price of the asset over a user-defined period (default is 14 periods). This SMA tracks the price closely and is sensitive to changes in market direction.
- **Smoothing SMA (oscV):** This second SMA is applied to the primary SMA, further smoothing the data and helping to filter out minor price movements that might otherwise be mistaken for trend reversals. The default period for this smoothing is 50, but it can be adjusted to suit the trader's preference.
2. **Color-Coding for Trend Visualization:**
- One of the most distinctive features of this indicator is its use of color to represent market trends. The indicator’s line changes color based on the relationship between the primary SMA and the smoothing SMA:
- **Bullish (Green):** The line turns green when the primary SMA is equal to or greater than the smoothing SMA, indicating that the market is in an upward trend.
- **Bearish (Red):** Conversely, the line turns red when the primary SMA falls below the smoothing SMA, signaling a downward trend.
- This color-coded system provides traders with an immediate, easy-to-interpret visual cue about the market’s direction, allowing for quick decision-making.
#### Detailed Explanation of Inputs
1. **Bullish Color (Default: Green #00ff00):**
- This input allows traders to customize the color that represents bullish trends on the chart. The default setting is green, a color commonly associated with upward market movement. However, traders can adjust this to any color that suits their visual preferences or matches their overall chart theme.
2. **Bearish Color (Default: Red RGB: 245, 0, 0):**
- The bearish color input determines the color of the line when the market is trending downwards. The default setting is a vivid red, signaling caution or selling opportunities. Like the bullish color, this can be customized to fit the trader’s needs.
3. **Line Thickness (Default: 5):**
- This setting controls the thickness of the line plotted by the indicator. The default thickness of 5 makes the line prominent on the chart, ensuring that the trend is easily visible even in complex or crowded chart setups. Traders can adjust the thickness to make the line thinner or thicker, depending on their visual preferences.
4. **Primary SMA Period (Value 1 - Default: 14):**
- The primary SMA period defines how many periods (e.g., days, hours) are used to calculate the moving average based on the asset’s closing prices. The default period of 14 is a balanced setting that offers a good mix of responsiveness and stability, but traders can adjust this depending on their trading style:
- **Shorter Periods (e.g., 5-10):** These make the indicator more sensitive, capturing trends more quickly but also increasing the likelihood of reacting to short-term price fluctuations or "noise."
- **Longer Periods (e.g., 20-50):** These smooth the data more, providing a more stable trend line that is less prone to whipsaws but may be slower to respond to trend changes.
5. **Smoothing SMA Period (Value 2 - Default: 50):**
- The smoothing SMA period determines how much the primary SMA is smoothed. A longer smoothing period results in a more gradual, stable line that focuses on the broader trend. The default of 50 is designed to smooth out most of the short-term fluctuations while still being responsive enough to detect significant trend shifts.
- **Customization:**
- **Shorter Smoothing Periods (e.g., 20-30):** Make the indicator more responsive, better for fast-moving markets or for traders who want to capture quick trends.
- **Longer Smoothing Periods (e.g., 70-100):** Enhance stability, ideal for long-term traders looking to avoid reacting to minor price movements.
#### Unique Characteristics and Advantages
1. **Simplicity and Clarity:**
- The Uptrick: Trend SMA Oscillator’s design prioritizes simplicity without sacrificing effectiveness. By relying on the widely understood SMA, it avoids the complexity of more esoteric indicators while still providing reliable trend signals. This simplicity makes it accessible to traders of all levels, from novices who are just learning about technical analysis to experienced traders looking for a straightforward, dependable tool.
2. **Visual Feedback Mechanism:**
- The indicator’s use of color to signify market trends is a particularly powerful feature. This visual feedback mechanism allows traders to assess market conditions at a glance. The clarity of the green and red color scheme reduces the mental effort required to interpret the indicator, freeing the trader to focus on strategy execution.
3. **Adaptability Across Markets and Timeframes:**
- One of the strengths of the Uptrick: Trend SMA Oscillator is its versatility. The basic principles of moving averages apply equally well across different asset classes and timeframes. Whether trading stocks, forex, commodities, or cryptocurrencies, traders can use this indicator to gain insights into market trends.
- **Intraday Trading:** For day traders who operate on short timeframes (e.g., 1-minute, 5-minute charts), the oscillator can be adjusted to be more responsive, capturing quick shifts in momentum.
- **Swing Trading:** Swing traders, who typically hold positions for several days to weeks, will find the default settings or slightly adjusted periods ideal for identifying and riding medium-term trends.
- **Long-Term Trading:** Position traders and investors can adjust the indicator to focus on long-term trends by increasing the periods for both the primary and smoothing SMAs, filtering out minor fluctuations and highlighting sustained market movements.
4. **Minimal Lag:**
- One of the challenges with moving averages is lag—the delay between when the price changes and when the indicator reflects this change. The Uptrick: Trend SMA Oscillator addresses this by allowing traders to adjust the periods to find a balance between responsiveness and stability. While all SMAs inherently have some lag, the customizable nature of this indicator helps traders mitigate this effect to align with their specific trading goals.
5. **Customizable and Intuitive:**
- While many technical indicators come with a fixed set of parameters, the Uptrick: Trend SMA Oscillator is fully customizable, allowing traders to tailor it to their trading style, market conditions, and personal preferences. This makes it a highly flexible tool that can be adjusted as markets evolve or as a trader’s strategy changes over time.
#### Practical Applications for Different Trader Profiles
1. **Day Traders:**
- **Use Case:** Day traders can customize the SMA periods to create a faster, more responsive indicator. This allows them to capture short-term trends and make quick decisions. For example, reducing the primary SMA to 5 and the smoothing SMA to 20 can help day traders react promptly to intraday price movements.
- **Strategy Integration:** Day traders might use the Uptrick: Trend SMA Oscillator in conjunction with volume-based indicators to confirm the strength of a trend before entering or exiting trades.
2. **Swing Traders:**
- **Use Case:** Swing traders can use the default settings or slightly adjust them to smooth out minor price fluctuations while still capturing medium-term trends. This approach helps in identifying the optimal points to enter or exit trades based on the broader market direction.
- **Strategy Integration:** Swing traders can combine this indicator with oscillators like the Relative Strength Index (RSI) to confirm overbought or oversold conditions, thereby refining their entry and exit strategies.
3. **Position Traders:**
- **Use Case:** Position traders, who hold trades for extended periods, can extend the SMA periods to focus on long-term trends. By doing so, they minimize the impact of short-term market noise and focus on the underlying trend.
- **Strategy Integration:** Position traders might use the Uptrick: Trend SMA Oscillator in combination with fundamental analysis. The indicator can help confirm the timing of entries and exits based on broader economic or corporate developments.
4. **Algorithmic and Quantitative Traders:**
- **Use Case:** The simplicity and clear logic of the Uptrick: Trend SMA Oscillator make it an excellent candidate for algorithmic trading strategies. Its binary output—bullish or bearish—can be easily coded into automated trading systems.
- **Strategy Integration:** Quant traders might use the indicator as part of a larger trading system that incorporates multiple indicators and rules, optimizing the SMA periods based on historical backtesting to achieve the best results.
5. **Novice Traders:**
- **Use Case:** Beginners can use the Uptrick: Trend SMA Oscillator to learn the basics of trend-following strategies.
The visual simplicity of the color-coded line helps novice traders quickly understand market direction without the need to interpret complex data.
- **Educational Value:** The indicator serves as an excellent starting point for those new to technical analysis, providing a practical example of how moving averages work in a real-world trading environment.
#### Combining the Indicator with Other Tools
1. **Relative Strength Index (RSI):**
- The RSI is a momentum oscillator that measures the speed and change of price movements. When combined with the Uptrick: Trend SMA Oscillator, traders can look for instances where the RSI shows divergence from the price while the oscillator confirms the trend. This can be a powerful signal of an impending reversal or continuation.
2. **Moving Average Convergence Divergence (MACD):**
- The MACD is another popular trend-following momentum indicator. By using it alongside the Uptrick: Trend SMA Oscillator, traders can confirm the strength of a trend and identify potential entry and exit points with greater confidence. For example, a bullish crossover on the MACD that coincides with the Uptrick: Trend SMA Oscillator turning green can be a strong buy signal.
3. **Volume Indicators:**
- Volume is often considered the fuel behind price movements. Using volume indicators like the On-Balance Volume (OBV) or Volume Weighted Average Price (VWAP) in conjunction with the Uptrick: Trend SMA Oscillator can help traders confirm the validity of a trend. A trend identified by the oscillator that is supported by increasing volume is typically more reliable.
4. **Fibonacci Retracement:**
- Fibonacci retracement levels are used to identify potential reversal levels in a trending market. When the Uptrick: Trend SMA Oscillator indicates a trend, traders can use Fibonacci retracement levels to find potential entry points that align with the broader trend direction.
#### Implementation in Different Market Conditions
1. **Trending Markets:**
- The Uptrick: Trend SMA Oscillator excels in trending markets, where it provides clear signals on the direction of the trend. In a strong uptrend, the line will remain green, helping traders stay in the trade for longer periods. In a downtrend, the red line will signal the continuation of bearish conditions, prompting traders to stay short or avoid long positions.
2. **Sideways or Range-Bound Markets:**
- In range-bound markets, where price oscillates within a confined range without a clear trend, the Uptrick: Trend SMA Oscillator may produce more frequent changes in color. While this could indicate potential reversals at the range boundaries, traders should be cautious of false signals. It may be beneficial to pair the oscillator with a volatility indicator to better navigate such conditions.
3. **Volatile Markets:**
- In highly volatile markets, where prices can swing rapidly, the sensitivity of the Uptrick: Trend SMA Oscillator can be adjusted by modifying the SMA periods. A shorter SMA period might capture quick trends, but traders should be aware of the increased risk of whipsaws. Combining the oscillator with a volatility filter or using it in a higher time frame might help mitigate some of this risk.
#### Final Thoughts
The "Uptrick: Trend SMA Oscillator" is a versatile, easy-to-use indicator that stands out for its simplicity, visual clarity, and adaptability. It provides traders with a straightforward method to identify and follow market trends, using the well-established concept of moving averages. The indicator’s customizable nature makes it suitable for a wide range of trading styles, from day trading to long-term investing, and across various asset classes.
By offering immediate visual feedback through color-coded signals, the Uptrick: Trend SMA Oscillator simplifies the decision-making process, allowing traders to focus on execution rather than interpretation. Whether used on its own or as part of a broader technical analysis toolkit, this indicator has the potential to enhance trading strategies and improve overall performance.
Its accessibility and ease of use make it particularly appealing to novice traders, while its adaptability and reliability ensure that it remains a valuable tool for more experienced market participants. As markets continue to evolve, the Uptrick: Trend SMA Oscillator remains a timeless tool, rooted in the fundamental principles of technical analysis, yet flexible enough to meet the demands of modern trading.
Search in scripts for "relative strength"

Supertrend with Extreme SignalsOriginality and Usefulness
The "Supertrend with Extreme Signals" indicator is an innovative tool I've developed to combine the strengths of the Supertrend indicator with the RSI (Relative Strength Index). This combination enhances the accuracy of entry and exit signals, making it more useful for traders looking to gain a comprehensive understanding of market conditions.
Justification for Mashup:
Supertrend: This is a trend-following indicator that identifies the current market trend and potential reversal points by adjusting dynamically based on market volatility.
RSI: A momentum oscillator that measures the speed and change of price movements. It helps pinpoint overbought and oversold conditions, adding an extra layer of confirmation to trend signals.
By merging these two indicators, the script filters out false signals and improves the precision of trade entries and exits. The Supertrend identifies the trend direction, while the RSI confirms the strength and potential reversals within that trend.
Description
Overview
The "Supertrend with Extreme Signals" indicator is a powerful hybrid tool that brings together the trend-following capability of the Supertrend and the momentum analysis of RSI. This integration provides clear buy and sell signals, helping traders make more informed decisions.
What It Does
Trend Identification: Utilizes the Supertrend to determine the prevailing market trend.
Signal Confirmation: Uses RSI to confirm signals by identifying overbought and oversold conditions.
Buy and Sell Signals: Generates buy signals when the price crosses above the Supertrend line and RSI indicates oversold conditions. Generates sell signals when the price crosses below the Supertrend line and RSI indicates overbought conditions.
How It Works
Supertrend Calculation:
Calculates the Average True Range (ATR) to assess market volatility.
Computes upper and lower levels based on the mid-price and ATR.
Determines trend direction by smoothing these levels over a specified period.
Dynamically adjusts the Supertrend value based on market conditions.
RSI Calculation:
Calculates the RSI over a defined period to measure price momentum.
Uses RSI levels to identify overbought (above 70) and oversold (below 30) conditions.
Signal Generation:
Buy Signal: Triggered when the price crosses above the Supertrend line and RSI is below the oversold threshold.
Sell Signal: Triggered when the price crosses below the Supertrend line and RSI is above the overbought threshold.
How to Use It
Trend Following: Use the Supertrend color to identify the current trend (green for uptrend, red for downtrend).
Entry Signals: Look for buy signals (green label) when the price crosses above the Supertrend line and RSI is in the oversold zone.
Exit Signals: Look for sell signals (red label) when the price crosses below the Supertrend line and RSI is in the overbought zone.
Visual Confirmation: The background color changes based on the trend direction, providing a quick visual cue for the current market state.
This script is especially useful for traders who combine trend-following strategies with momentum indicators. It helps filter out false signals and provides a robust framework for identifying profitable trading opportunities.
Concepts Underlying Calculations
ATR (Average True Range): Measures market volatility by calculating the average range of price movements over a specified period.
Supertrend: A trend-following indicator that adjusts dynamically based on market volatility.
RSI (Relative Strength Index): A momentum oscillator that measures the speed and change of price movements, helping to identify overbought and oversold conditions.
By combining these concepts, the "Supertrend with Extreme Signals" indicator offers a balanced approach to trading. It considers both trend direction and market momentum, making it a powerful tool for improving trading performance through informed market analysis.

Trend Strength | Flux Charts💎 GENERAL OVERVIEW
Introducing the new Trend Strength indicator! Latest trends and their strengths play an important role for traders. This indicator aims to make trend and strength detection much easier by coloring candlesticks based on the current strength of trend. More info about the process in the "How Does It Work" section.
Features of the new Trend Strength Indicator :
3 Trend Detection Algorithms Combined (RSI, Supertrend & EMA Cross)
Fully Customizable Algorithm
Strength Labels
Customizable Colors For Bullish, Neutral & Bearish Trends
📌 HOW DOES IT WORK ?
This indicator uses three different methods of trend detection and combines them all into one value. First, the RSI is calculated. The RSI outputs a value between 0 & 100, which this indicator maps into -100 <-> 100. Let this value be named RSI. Then, the Supertrend is calculated. Let SPR be -1 if the calculated Supertrend is bearish, and 1 if it's bullish. After that, latest EMA Cross is calculated. This is done by checking the distance between the two EMA's adjusted by the user. Let EMADiff = EMA1 - EMA2. Then EMADiff is mapped from -ATR * 2 <-> ATR * 2 to -100 <-> 100.
Then a Total Strength (TS) is calculated by given formula : RSI * 0.5 + SPR * 0.2 + EMADiff * 0.3
The TS value is between -100 <-> 100, -100 being fully bearish, 0 being true neutral and 100 being fully bullish.
Then the Total Strength is converted into a color adjusted by the user. The candlesticks in the chart will be presented with the calculated color.
If the Labels setting is enabled, each time the trend changes direction a label will appear indicating the new direction. The latest candlestick will always show the current trend with a label.
EMA = Exponential Moving Average
RSI = Relative Strength Index
ATR = Average True Range
🚩 UNIQUENESS
The main point that differentiates this indicator from others is it's simplicity and customization options. The indicator interprets trend and strength detection in it's own way, combining 3 different well-known trend detection methods: RSI, Supertrend & EMA Cross into one simple method. The algorithm is fully customizable and all styling options are adjustable for the user's liking.
⚙️ SETTINGS
1. General Configuration
Detection Length -> This setting determines the amount of candlesticks the indicator will look for trend detection. Higher settings may help the indicator find longer trends, while lower settings will help with finding smaller trends.
Smoothing -> Higher settings will result in longer periods of time required for trend to change direction from bullish to bearish and vice versa.
EMA Lengths -> You can enter two EMA Lengths here, the second one must be longer than the first one. When the shorter one crosses under the longer one, this will be a bearish sign, and if it crosses above it will be a bullish sign for the indicator.
Labels -> Enables / Disables trend strength labels.

Adaptive Bollinger-RSI Trend Signal [CHE]Adaptive Bollinger-RSI Trend Signal
Indicator Overview:
The "Adaptive Bollinger-RSI Trend Signal " (ABRT Signal ) is a sophisticated trading tool designed to provide clear and actionable buy and sell signals by combining the power of Bollinger Bands and the Relative Strength Index (RSI). This indicator aims to help traders identify potential trend reversals and confirm entry and exit points with greater accuracy.
Key Features:
1. Bollinger Bands Integration:
- Utilizes Bollinger Bands to detect price volatility and identify overbought or oversold conditions.
- Configurable parameters: Length, Source, and Multiplier for precise adjustments based on trading preferences.
- Color customization: Change the colors of the basis line, upper band, lower band, and the fill color between bands.
2. RSI Integration:
- Incorporates the Relative Strength Index (RSI) to validate potential buy and sell signals.
- Configurable parameters: Length, Source, Upper Threshold, and Lower Threshold for customized signal generation.
3. Signal Generation:
- Buy Signal: Generated when the price crosses below the lower Bollinger Band and the RSI crosses above the lower threshold, indicating a potential upward trend.
- Sell Signal: Generated when the price crosses above the upper Bollinger Band and the RSI crosses below the upper threshold, indicating a potential downward trend.
- Color customization: Change the colors of the buy and sell signal labels.
4. State Tracking:
- Tracks and records crossover and crossunder states of the price and RSI to ensure signals are only generated under the right conditions.
- Monitors the basis trend (SMA of the Bollinger Bands) to provide context for signal validation.
5. Counters and Labels:
- Labels each buy and sell signal with a counter to indicate the number of consecutive signals.
- Counters reset upon the generation of an opposite signal, ensuring clarity and preventing signal clutter.
6. DCA (Dollar-Cost Averaging) Calculation:
- Stores the close price at each signal and calculates the average entry price (DCA) for both buy and sell signals.
- Displays the number of positions and DCA values in a label on the chart.
7. Customizable Inputs:
- Easily adjustable parameters for Bollinger Bands, RSI, and colors to suit various trading strategies and timeframes.
- Boolean input to show or hide the table label displaying position counts and DCA values.
- Intuitive and user-friendly configuration options for traders of all experience levels.
How to Use:
1. Setup:
- Add the "Adaptive Bollinger-RSI Trend Signal " to your TradingView chart.
- Customize the input parameters to match your trading style and preferred timeframe.
- Adjust the colors of the indicator elements to your preference for better visibility and clarity.
2. Interpreting Signals:
- Buy Signal: Look for a "Buy" label on the chart, indicating a potential entry point when the price is oversold and RSI signals upward momentum.
- Sell Signal: Look for a "Sell" label on the chart, indicating a potential exit point when the price is overbought and RSI signals downward momentum.
3. Trade Execution:
- Use the buy and sell signals to guide your trade entries and exits, aligning them with your overall trading strategy.
- Monitor the counter labels to understand the strength and frequency of signals, helping you make informed decisions.
4. Adjust and Optimize:
- Regularly review and adjust the indicator parameters based on market conditions and backtesting results.
- Combine this indicator with other technical analysis tools to enhance your trading accuracy and performance.
5. Monitor DCA Values:
- Enable the table label to display the number of positions and average entry prices (DCA) for both buy and sell signals.
- Use this information to assess the cost basis of your trades and make strategic adjustments as needed.
Conclusion:
The Adaptive Bollinger-RSI Trend Signal is a powerful and versatile trading tool designed to help traders identify and capitalize on trend reversals with confidence. By combining the strengths of Bollinger Bands and RSI, this indicator provides clear and reliable signals, making it an essential addition to any trader's toolkit. Customize the settings, interpret the signals, and execute your trades with precision using this comprehensive indicator.

Yeong RRGThe code outlines a trading strategy that leverages Relative Strength (RS) and Rate of Change (RoC) to make trading decisions. Here's a detailed breakdown of the tactic described by the code:
Ticker and Period Selection: The strategy begins by selecting a stock ticker symbol and defining a period (len) for the calculations, which defaults to 14 but can be adjusted by the user.
Stock and Index Data Retrieval: It fetches the closing price (stock_close) of the chosen stock and calculates its 25-period exponential moving average (stock_ema). Additionally, it retrieves the closing price of the S&P 500 Index (index_close), used as a benchmark for calculating Relative Strength.
Relative Strength Calculation: The Relative Strength (rs) is computed by dividing the stock's closing price by the index's closing price, then multiplying by 100 to scale the result. This metric is used to assess the stock's performance relative to the broader market.
Moving RS Ratio and Rate of Change: The strategy calculates a Simple Moving Average (sma) of the RS over the specified period to get the RS Ratio (rs_ratio). It then computes the Rate of Change (roc) of this RS Ratio over the same period to get the RM Ratio (rm_ratio).
Normalization: The RS Ratio and RM Ratio are normalized using a formula that adjusts their values based on the mean and standard deviation of their respective series over the specified window. This normalization process helps in standardizing the indicators, making them easier to interpret and compare.
Indicator Plotting: The normalized RS Ratio (jdk_rs_ratio) and RM Ratio (jdk_rm_ratio) are plotted on the chart with different colors for visual analysis. A horizontal line (hline) at 100 serves as a reference point, indicating a neutral level for the indicators.
State Color Logic: The script includes a logic to determine the state color (statecolor) based on the previous state color and the current values of jdk_rs_ratio and jdk_rm_ratio. This color coding is intended to visually represent different market states: green for bullish, red for bearish, yellow for hold, and blue for watch conditions.
Signal Generation: The strategy generates buy, sell, hold, and watch signals based on the state color and the indicators' values relative to 100. For example, a buy signal is generated when both jdk_rs_ratio and jdk_rm_ratio are above 100, and the background color is set to green to reflect this bullish condition.
Trade Execution: Finally, the strategy executes trades based on the generated signals. A "BUY" trade is entered when a buy signal is present, and it is closed when a sell signal occurs.
Overall, the strategy uses a combination of RS and RoC indicators, normalized for better comparison, to identify potential buy and sell opportunities based on the stock's performance relative to the market and its momentum.

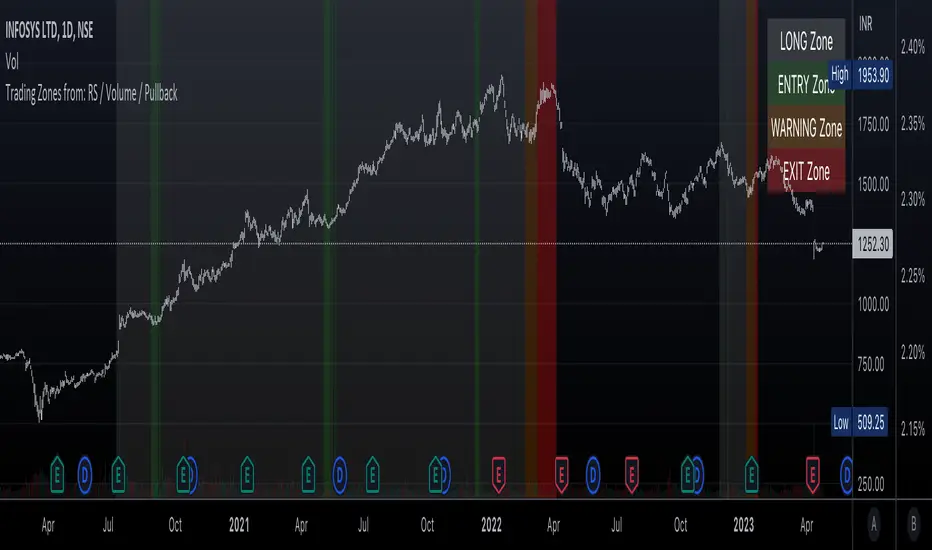
Trading Zones based on RS / Volume / PullbackThis is an Indicator which identifies different Trading Zones on the chart.
This should be Primarily used for Long Trades.
Trading Zones: and the Reasoning behind them
Long Zone -> One can do a Potential Entry (Buy) when this Zone is identified, but one could also wait for 'Entry Zone' (explained next) for a better Risk/Reward Trade.
Long Zones are identified with the help of Relative Strength and by an Intermediate Top in price.
Entry Zone -> This can be a better Risk/Reward zone to enter positions within the Long Zone.
Entry Zone is identified by a Pullback in Price & Volume contraction after the Long Zone is activated
Warning Zone -> One needs to be careful in this zone, no need to panic, Script will now try to find an Exit when Price Retraces towards Highs.
Warning Zone identifies weakness in the Price using Relative Strength of the current Stock (w.r.t. the Reference Symbol configured) and the severity of Pullback in Price.
Exit Zone -> are found only after transitioning to Warning Zone, this is a Zone which helps in minimising losses after a trade has gone into losses. Exit Zone is identified by making sure a local peak forms in Warning Zone. However, there are instances when Exit Zone detection can get prolonged when a local price peak is not formed soon enough. So one needs to be careful and use other strategies for exit.
------------------------------------------------------------------------------------
What is different in this Script:
The Script uses Relative Strength in combination with Pullback in Price from Highs in a Novel way.
Over-trading is avoided by ignoring Sideways price movements, using Relative Strength.
Only Trending Upward movement is detected and traded.
How to use this Indicator:
Use these 'Trading Zones' only as a reference so it can minimise your time in screening stocks.
Preferred Settings for using the Indicator:
Stick to 1-Day candles
Keep Relative Symbol as "Nifty" for Indian Stocks.
For US stocks, we can use "SPX" as the Relative Symbol.
//----------------
FEW EXAMPLES:
//----------------
ASIANPAINT
TATAMOTORS
TITAN
ITC
DIVISLAB
MARUTI
---------------------------------------------
Feedback is welcome.
Strength of Divergence Across Multiple IndicatorsOverview:
One-stop shop for all your divergence needs, including:
(1) A single metric for divergence strength across multiple indicators.
(2) Labels that make it easy to spot where the truly strong divergence is by showing the overall divergence strength value along with the number of divergent indicators. Hovering over the label shows a breakdown of each divergent indicator and its individual divergence strength value.
(3) Fully customizable, including inputs for pivot lengths, divergence types, and weights for every component of the divergence strength calculation. This allows you to quickly and easily optimize the output for any chart. Don't worry, the default settings will have you covered if you're not interested in what's going on under the hood.
The Divergence Strength Calculation:
The total divergence strength value is the sum of the divergence strengths of all indicators for which divergence was detected at a given bar. Each indicator's individual divergence strength is comprised of two basic components: (1) |ΔPrice| - the magnitude of the change in price over the divergence period (pivot-to-pivot), and (2) |ΔIndicator| - the magnitude of the change in indicator value over the divergence period.
Because different indicators' scales and volatility can vary greatly, the Δ values are expressed in terms of standard deviation to ensure that the values are meaningful and equitable across all indicators and assets/instruments/currency pairs, etc:
|ΔIndicator| = |indicator_value_1 - indicator_value_2| / 2 * StDev(indicator_series,100)
Calculation Weights:
All components of the calculation are weighted and can be modified on the Inputs page in settings (weights are simply multipliers). For example, if you think hidden divergence should carry less weight than regular divergence, you can assign it a lesser weight. Or if you think RSI divergence is worth more than OBV divergence, you can adjust their weights accordingly. List of weights:
Regular divergence weight - default = 1
Hidden divergence weight - default = 1
ΔPrice weight - default = 0.5 (multiplied by the ΔPrice component)
ΔIndicator weight - default = 1.5 (multiplied by the ΔIndicator component)
RSI weight - default = 1.1
OBV weight - default = 0.8
MACD weight - default = 0.9
STOCH weight - default = 0.9
Development for additional indicators is ongoing, as is research into the optimal weight configuration(s).
Other Inputs:
Pivot lengths - specify the number of bars before and after each pivot high/low to consider it a valid candidate for divergence.
Lookback bars and Lookback pivots - specify the number of bars or the number of pivots to look back across.
Price sources - specify separate price sources for bullish and bearish divergence
Display settings - specify how lines and labels should display, including which divergence strength values should show the largest labels. Include/exclude specific divergence types and indicators.
Please report any bugs, or let me know if you have any enhancement suggestions or requests for additional indicators.
@reees

RAS.V2 Strength Index OscillatorHeavily modified version of my previous "Relative Aggregate Strength Oscillator" -Added high/low lines, alma curves,, lrc bands, changed candle calculations + other small things. Replaces the standard RSI indicator with something a bit more insightful.
Credits to @wolneyyy - 'Mean Deviation Detector - Throw Out All Other Indicators ' And @algomojo - 'Responsive Coppock Curve'
And the default Relative Strength Index
The candles are the average of the MFI ,CCI ,MOM and RSI candles, they seemed similar enough in style to me so I created candles out of each and the took the sum of all the candle's OHLC values and divided by 4 to get an average, same as v1 but with some tweaks. Previous Peaks and Potholes visible with the blue horizontal lines which adjust when a new boundary is established. Toggle alma waves or smalrc curves or both to your liking. This indicator is great for calling out peaks and troughs in realtime, although is best when combined with other trusted indicators to get a consensus.

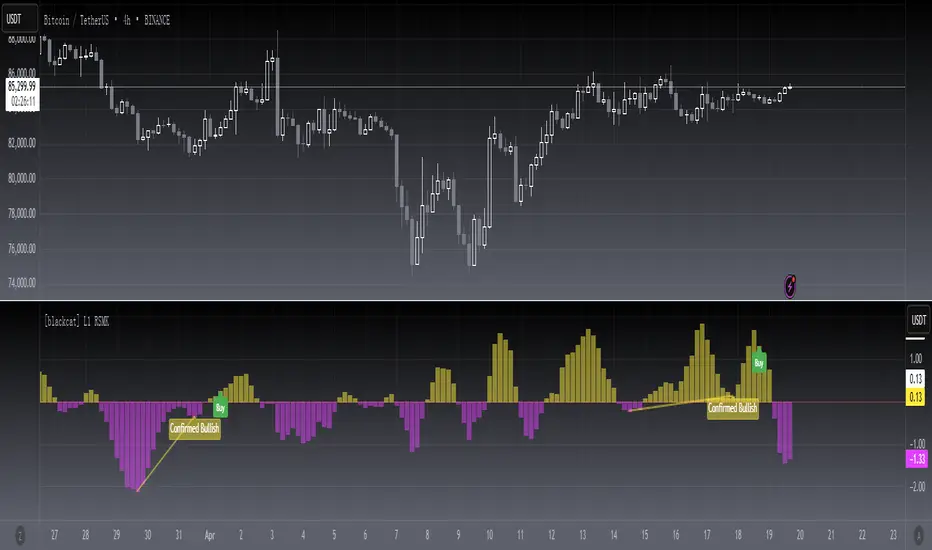
[blackcat] L1 RSMKLevel 1
Background
This is a modified version of indicator from Markos Katsanos’ article in the March issue, “Using Relative Strength To Outperform The Market”.
Function
In “Using Relative Strength To Outperform The Market” in this issue, author Markos Katsanos presents a trading system based on a new relative strength indicator he calls RSMK. The indicator improves on the traditional relative strength indicator by separating periods of strong or weak relative strength.
I found it helpful for divergence identification.
Remarks
This is a Level 1 free and open source indicator.
Feedbacks are appreciated.
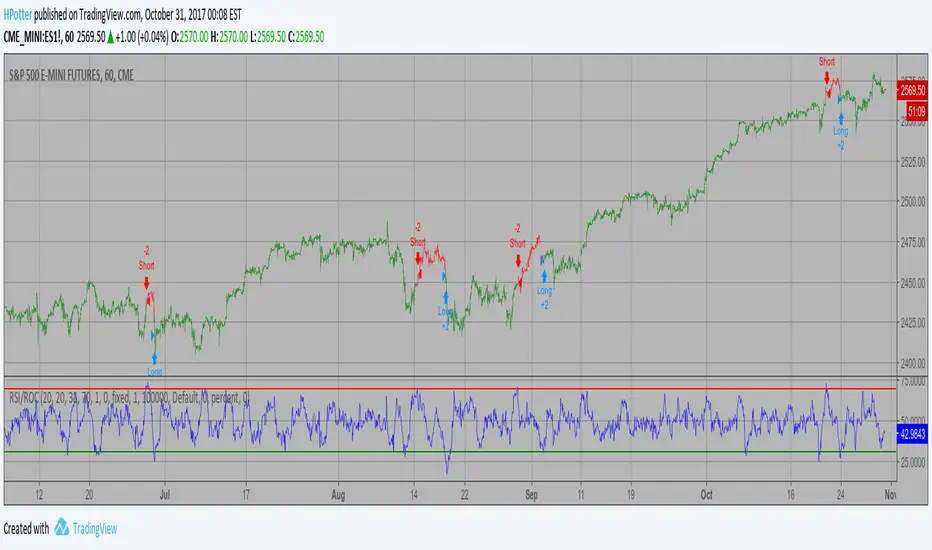
Combo Backtest 123 Reversal & RSI based on ROC This is combo strategies for get a cumulative signal.
First strategy
This System was created from the Book "How I Tripled My Money In The
Futures Market" by Ulf Jensen, Page 183. This is reverse type of strategies.
The strategy buys at market, if close price is higher than the previous close
during 2 days and the meaning of 9-days Stochastic Slow Oscillator is lower than 50.
The strategy sells at market, if close price is lower than the previous close price
during 2 days and the meaning of 9-days Stochastic Fast Oscillator is higher than 50.
Second strategy
This is the new-age indicator which is version of RSI calculated upon
the Rate-of-change indicator.
The name "Relative Strength Index" is slightly misleading as the RSI
does not compare the relative strength of two securities, but rather
the internal strength of a single security. A more appropriate name
might be "Internal Strength Index." Relative strength charts that compare
two market indices, which are often referred to as Comparative Relative Strength.
And in its turn, the Rate-of-Change ("ROC") indicator displays the difference
between the current price and the price x-time periods ago. The difference can
be displayed in either points or as a percentage. The Momentum indicator displays
the same information, but expresses it as a ratio.
WARNING:
- For purpose educate only
- This script to change bars colors.

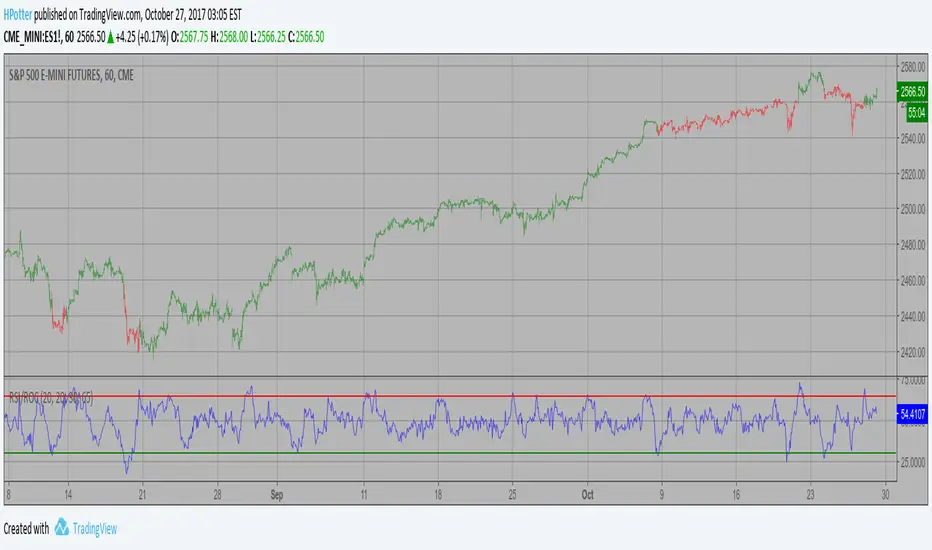
RSI based on ROC Backtest This is the new-age indicator which is version of RSI calculated upon
the Rate-of-change indicator.
The name "Relative Strength Index" is slightly misleading as the RSI
does not compare the relative strength of two securities, but rather
the internal strength of a single security. A more appropriate name
might be "Internal Strength Index." Relative strength charts that compare
two market indices, which are often referred to as Comparative Relative Strength.
And in its turn, the Rate-of-Change ("ROC") indicator displays the difference
between the current price and the price x-time periods ago. The difference can
be displayed in either points or as a percentage. The Momentum indicator displays
the same information, but expresses it as a ratio.
You can change long to short in the Input Settings
WARNING:
- For purpose educate only
- This script to change bars colors.
RSI based on ROC Strategy This is the new-age indicator which is version of RSI calculated upon
the Rate-of-change indicator.
The name "Relative Strength Index" is slightly misleading as the RSI
does not compare the relative strength of two securities, but rather
the internal strength of a single security. A more appropriate name
might be "Internal Strength Index." Relative strength charts that compare
two market indices, which are often referred to as Comparative Relative Strength.
And in its turn, the Rate-of-Change ("ROC") indicator displays the difference
between the current price and the price x-time periods ago. The difference can
be displayed in either points or as a percentage. The Momentum indicator displays
the same information, but expresses it as a ratio.
WARNING:
- This script to change bars colors.
RSI based on ROC This is the new-age indicator which is version of RSI calculated upon
the Rate-of-change indicator.
The name "Relative Strength Index" is slightly misleading as the RSI
does not compare the relative strength of two securities, but rather
the internal strength of a single security. A more appropriate name
might be "Internal Strength Index." Relative strength charts that compare
two market indices, which are often referred to as Comparative Relative Strength.
And in its turn, the Rate-of-Change ("ROC") indicator displays the difference
between the current price and the price x-time periods ago. The difference can
be displayed in either points or as a percentage. The Momentum indicator displays
the same information, but expresses it as a ratio.
Composite Buy/Sell Score [-100 to +100] by LMComposite Buy/Sell Score (Stabilized + Sensitivity) by LM
Description:
This indicator calculates a composite trend strength score ranging from -100 to +100 by combining multiple popular technical indicators into a single, smoothed metric. It is designed to give traders a clear view of bullish and bearish trends, while filtering out short-term noise.
The score incorporates signals from:
PPO (Percentage Price Oscillator) – measures momentum via the difference between fast and slow EMAs.
ADX (Average Directional Index) – detects trend strength.
RSI (Relative Strength Index) – identifies short-term momentum swings.
Stochastic RSI – measures RSI momentum and speed of change.
MACD (Moving Average Convergence Divergence) – detects momentum shifts using EMA crossovers.
Williams %R – highlights overbought/oversold conditions.
Each component is weighted, smoothed, and optionally confirmed across a configurable number of bars, producing a stabilized composite score that reacts more reliably to significant trend changes.
Key Features:
Smoothed Composite Score
The final score is smoothed using an EMA to reduce volatility and emphasize meaningful trends.
A Sensitivity Multiplier allows traders to exaggerate the score for stronger trend signals or dampen it for quieter markets.
Customizable Inputs
You can adjust each indicator’s parameters, smoothing lengths, and confirm bars to suit your preferred timeframe and trading style.
The sensitivity multiplier allows fine-tuning the responsiveness of the trend line without changing underlying indicator calculations.
Visual Representation
Score Line: Green for positive (bullish) trends, red for negative (bearish) trends, gray near neutral.
Reference Lines:
0 = neutral
+100 = maximum bullish
-100 = maximum bearish
Adaptive Background: Optionally highlights the background intensity proportional to trend strength. Strong green for bullish trends, strong red for bearish trends.
Multi-Indicator Integration
Combines momentum, trend, and overbought/oversold signals into a single metric.
Helps identify clear entry/exit trends while avoiding whipsaw noise common in individual indicators.
Recommended Use:
Trend Identification: Look for sustained movement above 0 for bullish trends and below 0 for bearish trends.
Exaggerated Trends: Use the Sensitivity Multiplier to emphasize strong trends.
Filtering Noise: The smoothed score and confirmBars settings help reduce false signals from minor price fluctuations.
Inputs Overview:
Input Purpose
PPO Fast EMA / Slow EMA / Signal Controls PPO momentum sensitivity
ADX Length / Threshold Detects trend strength
RSI Length / Overbought / Oversold Measures short-term momentum
Stoch RSI Length / %K / %D Measures speed of RSI changes
MACD Fast / Slow / Signal Measures momentum crossover
Williams %R Length Detects overbought/oversold conditions
Final Score Smoothing Length EMA smoothing for final composite score
Confirm Bars for Each Signal Number of bars used to confirm individual indicator signals
Sensitivity Multiplier Scales the final composite score for exaggerated trend response
Highlight Background by Trend Strength Enables adaptive background coloring
This indicator is suitable for traders looking for a single, clear trend metric derived from multiple indicators. It can be applied to any timeframe and can help identify both strong and emerging trends in the market.

Hyper Strength Index | QuantLapse🧠 Hyper Strength Index (HSI) | QuantLapse
Overview:
The Hyper Strength Index (HSI) is a composite momentum oscillator designed to unify multiple strength measures into a single, adaptive framework. It combines the Relative Strength Index (RSI), Chande Momentum Oscillator (CMO), Money Flow Index (MFI), and Stochastic RSI to deliver a refined, multidimensional view of market momentum and overbought/oversold conditions.
Unlike traditional oscillators that rely on a single formula, the HSI averages four distinct momentum perspectives — price velocity, directional conviction, volume participation, and stochastic behavior — offering traders a more balanced and noise-resistant reading of market strength.
⚙️ Calculation Logic:
The Hyper Strength Index is computed as the normalized average of:
📈 RSI — classic measure of relative momentum.
💪 CMO — captures directional bias and intensity of moves.
💵 MFI — integrates volume and money flow pressure.
🔄 Stochastic RSI (K-line) — identifies momentum extremes and short-term turning points.
This fusion creates a smoother, more comprehensive signal, mitigating the weaknesses of any single oscillator.
🎯 Interpretation:
Overbought Zone (Default: > 75):
Indicates potential exhaustion of bullish momentum — a cooling phase or reversal may follow.
Oversold Zone (Default: < 7):
Suggests bearish exhaustion — a rebound or accumulation phase may emerge.
Neutral Zone (Between 7 and 75):
Represents balanced market conditions or trend continuation phases.
Visual cues highlight key conditions:
🔺 Red Highlights — Overbought regions or downward inflection points.
🔻 Green Highlights — Oversold regions or upward inflection points.
Neutral zones are shaded with subtle gray backgrounds for clarity.
💡 Key Features:
🔹 Multi-factor strength analysis (RSI + CMO + MFI + StochRSI).
🔹 Adaptive overbought/oversold detection.
🔹 Visual alerts via colored backgrounds and bar markers.
🔹 Customizable smoothing and length parameters for fine-tuning sensitivity.
🔹 Intuitive visualization ideal for both short-term scalping and swing trading setups.
🧭 Usage Notes:
Works best as a momentum confirmation tool — pair with trend filters like EMA, SuperTrend, or ADX.
In trending markets, use crossovers from extreme zones as potential continuation or exhaustion signals.
In ranging markets, exploit overbought/oversold reversals for high-probability mean reversion trades.
📘 Summary:
The Hyper Strength Index | QuantLapse distills multiple dimensions of market strength into a single, cohesive oscillator. By merging price, volume, and directional momentum, it provides traders with a more robust, responsive, and context-aware perspective on market dynamics — a next-generation evolution beyond the limitations of RSI or CMO alone.

TradeScope: MA Reversion • RVOL • Trendlines • GAPs • TableTradeScope is an all-in-one technical analysis suite that brings together price action, momentum, volume dynamics, and trend structure into one cohesive and fully customizable indicator.
An advanced, modular trading suite that combines moving averages, reversion signals, RSI/CCI momentum, relative volume, gap detection, trendline analysis, and dynamic tables — all within one powerful dashboard.
Perfect for swing traders, intraday traders, and analysts who want to read price strength, volume context, and market structure in real time.
⚙️ Core Components & Inputs
🧮 Moving Average Settings
Moving Average Type & Length:
Choose between SMA or EMA and set your preferred period for smoother or more reactive trend tracking.
Multi-MA Plotting:
Up to 8 customizable moving averages (each with independent type, color, and length).
Includes a “window filter” to show only the last X bars, reducing chart clutter.
MA Reversion Engine:
Detects when price has extended too far from its moving average.
Reversion Lookback: Number of bars analyzed to determine historical extremes.
Reversion Threshold: Sensitivity multiplier—lower = more frequent signals, higher = stricter triggers.
🔄 Trend Settings
Short-Term & Long-Term Trend Lookbacks:
Uses linear regression to detect the slope and direction of the short- and long-term trend.
Results are displayed in the live table with color-coded bias:
🟩 Bullish | 🟥 Bearish
📈 Momentum Indicators
RSI (Relative Strength Index):
Adjustable period; displays the current RSI value, overbought (>70) / oversold (<30) zones, and trending direction.
CCI (Commodity Channel Index):
Customizable length with color-coded bias:
🟩 Oversold (< -100), 🟥 Overbought (> 100).
Tooltip shows whether the CCI is trending up or down.
📊 Volume Analysis
Relative Volume (RVOL):
Estimates end-of-day projected volume using intraday progress and compares it against the 20-day average.
Displays whether today’s volume is expected to exceed yesterday’s, and highlights color by strength.
Volume Trend (Short & Long Lookbacks):
Visual cues for whether current volume is above or below short-term and long-term averages.
Estimated Full-Day Volume & Multiplier:
Converts raw volume into “X” multiples (e.g., 2.3X average) for quick interpretation.
🕳️ Gap Detection
Automatically identifies and plots bullish and bearish price gaps within a defined lookback period.
Gap Lookback: Defines how far back to search for gaps.
Gap Line Width / Visibility: Controls the thickness and display of gap lines on chart.
Displays the closest open gap in the live table, including its distance from current price (%).
🔍 ATR & Volatility
14-day ATR (% of price):
Automatically converts the Average True Range into a percent, providing quick volatility context:
🟩 Low (<3%) | 🟨 Moderate (3–5%) | 🟥 High (>5%)
💬 Candlestick Pattern Recognition
Auto-detects popular reversal and continuation patterns such as:
Bullish/Bearish Engulfing
Hammer / Hanging Man
Shooting Star / Inverted Hammer
Doji / Harami / Kicking / Marubozu / Morning Star
Each pattern is shown with contextual color coding in the table.
🧱 Pivot Points & Support/Resistance
Optional Pivot High / Pivot Low Labels
Adjustable left/right bar lengths for pivot detection
Theme-aware text and label color options
Automatically drawn diagonal trendlines for both support and resistance
Adjustable line style, color, and thickness
Detects and tracks touches for reliability
Includes breakout alerts (with optional volume confirmation)
🚨 Alerts
MA Cross Alerts:
Triggers when price crosses the fast or slow moving average within a tolerance band (default ±0.3%).
Diagonal Breakout Alerts:
Detects and alerts when price breaks diagonal trendlines.
Volume-Confirmed Alerts:
Filters breakouts where volume exceeds 1.5× the 20-bar average.
🧾 Live Market Table
A fully dynamic table displayed on-chart, customizable via input toggles:
Choose which rows to show (e.g., RSI, ATR, RVOL, Gaps, CCI, Trend, MA info, Diff, Low→Close%).
Choose table position (top-right, bottom-left, etc.) and text size.
Theme selection: Light or Dark
Conditional background colors for instant visual interpretation:
🟩 Bullish or Oversold
🟥 Bearish or Overbought
🟨 Neutral / Moderate
🎯 Practical Uses
✅ Identify confluence setups combining MA reversion, volume expansion, and RSI/CCI extremes.
✅ Track trend bias and gap proximity directly in your dashboard.
✅ Monitor relative volume behavior for intraday strength confirmation.
✅ Automate MA cross or breakout alerts to stay ahead of key price action.
🧠 Ideal For
Swing traders seeking confluence-based setups
Intraday traders monitoring multi-factor bias
Analysts looking for compact market health dashboards
💡 Summary
TradeScope is designed as a single-pane-of-glass market view — combining momentum, trend, volume, structure, and reversion into one clear visual system.
Fully customizable. Fully dynamic.
Use it to see what others miss — clarity, confluence, and confidence in every trade.

Adaptive Convergence Divergence### Adaptive Convergence Divergence (ACD)
By Gurjit Singh
The Adaptive Convergence Divergence (ACD) reimagines the classic MACD by replacing fixed moving averages with adaptive moving averages. Instead of a static smoothing factor, it dynamically adjusts sensitivity based on price momentum, relative strength, volatility, fractal roughness, or volume pressure. This makes the oscillator more responsive in trending markets while filtering noise in choppy ranges.
#### 📌 Key Features
1. Dual Adaptive Structure: The oscillator uses two adaptive moving averages to form its convergence-divergence line, with EMA/RMA as signal line:
* Primary Adaptive (MA): Fast line, reacts quickly to changes.
* Following Adaptive (FAMA): Slow line, with half-alpha smoothing for confirmation.
2. Adaptive MA Types
* ACMO: Adaptive CMO (momentum)
* ARSI: Adaptive RSI (relative strength)
* FRMA: Fractal Roughness (volatility + fractal dimension)
* VOLA: Volume adaptive (volume pressure)
3. PPO Option: Switch between classic MACD or Percentage Price Oscillator (PPO) style calculation.
4. Signal Smoothing: Choose between EMA or Wilder’s RMA.
5. Visuals: Colored oscillator, signal line, histogram with adaptive transparency.
6. Alerts: Bullish/Bearish crossovers built-in.
#### 🔑 How to Use
1. Add to chart: Works on any timeframe and asset.
2. Choose MA Type: Experiment with ACMO, ARSI, FRMA, or VOLA depending on market regime.
3. Crossovers:
* Bullish (🐂): Oscillator crosses above signal → potential long entry.
* Bearish (🐻): Oscillator crosses below signal → potential short entry.
4. Histogram: expansion = strengthening trend; contraction = weakening trend.
5. Divergences:
* Bullish (hidden strength): Price pushes lower, but ACD turns higher = potential upward reversal.
* Bearish (hidden weakness): Price pushes higher, but ACD turns lower = potential downward reversal.
6. Customize: Adjust lengths, smoothing type, and PPO/MACD mode to match your style.
7. Set Alerts:
* Enable Bullish or Bearish crossover alerts to catch momentum shifts in real time.
#### 💡 Tips
* PPO mode normalizes values across assets, useful for cross-asset analysis.
* Wilder’s smoothing is gentler than EMA, reducing whipsaws in sideways conditions.
* Adaptive smoothing helps reduce false divergence signals by filtering noise in choppy ranges.

Ludvig Indicator PROThe Ludvig Indicator is designed to identify high-probability breakout setups by combining trend, volume, volatility, and relative strength filters. It helps you enter stocks (or ETFs/crypto) when institutional money is likely flowing in, while avoiding false breakouts and weak trends.
🔑 Core Features
Zero-Lag EMA (ZLEMA)
Faster, less lagging trend detection compared to traditional EMAs.
Used as the basis for dynamic ATR bands.
ATR Volatility Bands
Adaptive bands based on the Average True Range (ATR).
Define the zone where price must close outside to confirm trend strength.
Breakout Confirmation
Requires price to close above recent highs (lookback configurable).
Ensures signals are “true breakouts,” not just noise around moving averages.
Volume Filter (Relative Volume)
Validates breakouts with significantly higher volume than average.
Prevents low-liquidity signals from triggering.
Trend Strength (ADX)
Built-in ADX calculation ensures only strong, trending moves are considered.
Default filter: ADX ≥ 18 (configurable).
Relative Strength vs. Benchmark
Compares the asset’s momentum against a benchmark (default: SPY).
Only signals when the asset is outperforming the benchmark.
Useful for sector rotation and picking leaders instead of laggards.
Alerts & Signals
Breakout entries are marked with small green triangles.
Built-in alerts for automated notifications (TradingView alerts).

Range Breakout [sgbpulse]Range Breakout
1. Overview
The "Range Breakout " indicator is a powerful tool designed to identify and visually display price ranges on your chart using pivot points. It dynamically draws two distinct boxes – an External Range and an Internal Range – helping traders pinpoint potential support and resistance zones. Beyond its visual representation, the indicator offers a comprehensive set of 12 unique breakout alerts, providing real-time notifications for significant price movements outside these defined ranges. Additionally, it integrates RSI and MFI metrics for momentum confirmation.
2. How It Works
The indicator operates by identifying pivot points based on user-defined "left" and "right" bar lengths. A high pivot is a bar with a specified number of lower highs both to its left and right, and similarly for a low pivot.
External Range: Calculated using longer pivot lengths (default: 15 bars left, 6 bars right). This range represents broader, more significant price consolidation areas.
Internal Range: Calculated using shorter pivot lengths (default: 4 bars left, 3 bars right). This range captures tighter, more immediate price consolidations within the broader trend.
The External Range will always be greater than or equal to the Internal Range, as it's based on a wider historical context. Both ranges are displayed as transparent boxes on your chart, dynamically adjusting as new pivots are formed.
3. Key Features and Settings
Customizable Pivot Lengths:
External Range (Left/Right Bars): Adjust sensitivity for identifying the broader price range. Longer lengths lead to more stable, but less frequent, range updates.
Internal Range (Left/Right Bars): Adjust sensitivity for the tighter, more immediate price range.
Tool Tips: Minimum 6 bars for the External Range, and minimum 2 bars for the Internal Range.
Customizable Range Colors: Easily change the background colors of the External and Internal Range boxes to match your chart's aesthetic.
Dynamic Range Display: The indicator automatically updates the range boxes as new pivot highs and lows are formed, always presenting the most current valid ranges.
RSI / MFI Settings:
Timeframe Source: Select the timeframe for RSI and MFI calculation.
- Chart: Calculation based on the current chart timeframe.
- Daily: Always calculated based on the daily ("D") timeframe, even if the chart is on a lower timeframe.
RSI Length: Period length for RSI calculation (default: 14).
RSI Overbought Level: Overbought level for RSI (default: 70.0).
RSI Oversold Level: Oversold level for RSI (default: 30.0).
MFI Length: Period length for MFI calculation (default: 14).
MFI Overbought Level: Overbought level for MFI (default: 80.0).
MFI Oversold Level: Oversold level for MFI (default: 20.0).
4. Synergy of Ranges & Breakout Strength
The interaction between the External and Internal Ranges provides deep insights into price movement and breakout strength:
Immediate Direction: The movement of the Internal Range (up or down) indicates the short-term directional bias within the broader framework of the External Range.
Strength Confirmation: A breakout of the External Range, followed by a breakout of the Internal Range, confirms the strength of the move and increases confidence in the breakout.
Strong Momentum ("Leaving" Ranges Behind): When price breaks out with exceptionally strong momentum, it continues to move aggressively and does not immediately form new pivots. In such situations, the existing ranges (External and Internal) remain in place while the candles "leave them behind." A "Full Candle" breakout, where the entire candle moves past both ranges, indicates a particularly powerful and decisive move.
Momentum (RSI / MFI) as Confirmation:
- RSI (Relative Strength Index): Measures the speed and change of price movements. Extreme values (above 70 or below 30) indicate overbought/oversold conditions respectively, confirming strong momentum in a breakout.
- MFI (Money Flow Index): Similar to RSI but incorporates volume. Extreme values (above 80 or below 20) indicate strong money flow in/out, reinforcing breakout confirmation.
- Importance of Confirmation: If a breakout occurs but momentum indicators do not confirm it (for example, an upside breakout while RSI is declining), this could signal weakness in the move and the risk of a false breakout (Fakeout).
5. Visuals
The indicator provides clear visual representations on the chart:
Range Boxes:
Two dynamic boxes are drawn on the chart: one for the External Range and one for the Internal Range.
These boxes update continuously, displaying the current range boundaries based on the latest pivots. They provide an immediate visual indication of support and resistance levels.
RSI/MFI Status Labels:
Small text labels appear to the right of the current bar, vertically centered.
They display the status of RSI and MFI: RSI OB (Overbought), RSI OS (Oversold), MFI OB, MFI OS, along with the exact value.
Important: The labels remain on the chart as long as the condition holds (indicator is above/below the level), unlike alerts which mark a singular crossover event.
Plotting of Key Values:
The indicator plots six invisible series on the chart, primarily to allow the user to view the exact numerical values of:
- The upper and lower bounds of the External Range (External High, External Low).
- The upper and lower bounds of the Internal Range (Internal High, Internal Low).
- The calculated RSI and MFI values (RSI, MFI).
These values are accessible for viewing through TradingView's Data Window and also via the Status Line when hovering over the relevant candle. This enables more precise quantitative analysis of range levels and momentum.
6. Comprehensive Breakout Alerts
The "Range Breakout " indicator provides 12 distinct alert conditions for breakouts, allowing you to select the required level of confirmation for each alert. All alerts are triggered only upon a fully confirmed bar close (barstate.isconfirmed) to minimize false signals and ensure reliability.
All breakout alerts are configured to detect a Crossover/Crossunder of the levels, meaning a specific event where the price moves from one side of the range to the other.
External Range Breakout UP
- Close: Price closes above the External Range.
- Real Body: The entire "real body" of the candle (min of open/close prices) closes above the External Range.
- Full Candle: The entire candle (the lowest point of the candle) closes above the External Range.
External Range Breakout DOWN
- Close: Price closes below the External Range.
- Real Body: The entire "real body" of the candle (max of open/close prices) closes below the External Range.
- Full Candle: The entire candle (the highest point of the candle) closes below the External Range.
Internal Range Breakout UP
- Close: Price closes above the Internal Range.
- Real Body: The "real body" of the candle closes above the Internal Range.
- Full Candle: The entire candle closes above the Internal Range.
Internal Range Breakout DOWN
- Close: Price closes below the Internal Range.
- Real Body: The "real body" of the candle closes below the Internal Range.
- Full Candle: The entire candle closes below the Internal Range.
7. Ideal Use Cases
This indicator is ideal for traders who:
Want to clearly identify and monitor price consolidation zones.
Seek confirmation for breakout strategies across various timeframes.
Require reliable and automated alerts for potential entry or exit points based on range expansion.
8. Complementary Indicator
For even more comprehensive market analysis, we highly recommend using this indicator in conjunction with Market Structure Support & Resistance External/Internal & BoS .
This powerful complementary indicator automatically and accurately identifies significant support and resistance levels by locating high and low pivot points, as well as key Pre-Market High/Low levels. Its strength lies in its dynamic adaptability to any timeframe and asset, providing precise and relevant real-time levels while maintaining a clean chart. It also identifies Break of Structure (BoS) to signal potential trend changes or continuations.
Using both indicators together provides a robust framework for identifying defined ranges and potential trend shifts, enabling more informed trading decisions.
View Market Structure Support & Resistance External/Internal & BoS Indicator
9. Important Note: Trading Risk
This indicator is intended for educational and informational purposes only and does not constitute investment advice or a recommendation for trading in any form whatsoever.
Trading in financial markets involves significant risk of capital loss. It is important to remember that past performance is not indicative of future results. All trading decisions are your sole responsibility. Never trade with money you cannot afford to lose.

Crypto Risk-Weighted Allocation SuiteCrypto Risk-Weighted Allocation Suite
This indicator is designed to help users explore dynamic portfolio allocation frameworks for the crypto market. It calculates risk-adjusted allocation weights across major crypto sectors and cash based on multi-factor momentum and volatility signals. Best viewed on INDEX:BTCUSD 1D chart. Other charts and timeframes may give mixed signals and incoherent allocations.
🎯 How It Works
This model systematically evaluates the relative strength of:
BTC Dominance (CRYPTOCAP:BTC.D)
Represents Bitcoin’s share of the total crypto market. Rising dominance typically indicates defensive market phases or BTC-led trends.
ETH/BTC Ratio (BINANCE:ETHBTC)
Gauges Ethereum’s relative performance versus Bitcoin. This provides insight into whether ETH is leading risk appetite.
SOL/BTC Ratio (BINANCE:SOLBTC)
Measures Solana’s performance relative to Bitcoin, capturing mid-cap layer-1 strength.
Total Market Cap excluding BTC and ETH (CRYPTOCAP:TOTAL3ES)
Represents Altcoins as a broad category, reflecting appetite for higher-risk assets.
Each of these series is:
✅ Converted to a momentum slope over a configurable lookback period.
✅ Standardized into Z-scores to normalize changes relative to recent behavior.
✅ Smoothed optionally using a Hull Moving Average for cleaner signals.
✅ Divided by ATR-based volatility to create a risk-weighted score.
✅ Scaled to proportionally allocate exposure, applying user-configured minimum and maximum constraints.
🪙 Dynamic Allocation Logic
All signals are normalized to sum to 100% if fully confident.
An overall confidence factor (based on total signal strength) scales the allocation up or down.
Any residual is allocated to cash (unallocated capital) for conservative exposure.
The script automatically avoids “all-in” bias and prevents negative allocations.
📊 Outputs
The indicator displays:
Market Phase Detection (which asset class is currently leading)
Risk Mode (Risk On, Neutral, Risk Off)
Dynamic Allocations for BTC, ETH, SOL, Alts, and Cash
Optional momentum plots for transparency
🧠 Why This Is Unique
Unlike simple dominance indicators or crossovers, this model:
Integrates multiple cross-asset signals (BTC, ETH, SOL, Alts)
Adjusts exposure proportionally to signal strength
Normalizes by volatility, dynamically scaling risk
Includes configurable constraints to reflect your own risk tolerance
Provides a cash fallback allocation when conviction is low
Is entirely non-repainting and based on daily closing data
⚠️ Disclaimer
This script is provided for educational and informational purposes only.
It is not financial advice and should not be relied upon to make investment decisions.
Past performance does not guarantee future results.
Always consult a qualified financial advisor before acting on any information derived from this tool.
🛠 Recommended Use
As a framework to visualize relative momentum and risk-adjusted allocations
For research and backtesting ideas on portfolio allocation across crypto sectors
To help build your own risk management process
This script is not a turnkey strategy and should be customized to fit your goals.
✅ Enjoy exploring dynamic crypto allocations responsibly!

Mariam Market DashboardMariam Market Dashboard – A Quick Guide
Purpose:
Shows if the market is trending, volatile, or stuck so you can decide when to trade or wait.
How to Use
Add the indicator to your chart. Adjust basic settings like EMA, RSI, ATR lengths, and timezone if needed. Use it before entering any trade to confirm market conditions.
What Each Metric Means (with general ranges)
Session: Identifies which market session is active (New York, London, Tokyo).
Trend: Shows current market direction. “Up” means price above EMA and VWAP, “Down” means price below. Use this to confirm bullish or bearish bias.
HTF Trend: Confirms trend on a higher timeframe for stronger signals.
ATR (Average True Range): Measures market volatility or price movement speed.
Low ATR (e.g., below 0.5% of price) means quiet or slow market; high ATR (above 1% of price) means volatile or fast-moving market, good for active trades.
Strong Bar: A candlestick closing near its high (above 75% of range) indicates strong buying momentum; closing near its low indicates strong selling momentum.
Higher Volume: Volume higher than average (typically 10-20% above normal) means more market activity and stronger moves.
Volume / Avg Volume: Ratio above 1.2 (120%) shows volume is significantly higher than usual, signaling strong interest.
RVol % (Relative Volume %): Above 100% means volume is hotter than normal, increasing chances of strong moves; below 50% means low activity and possible indecision.
Delta: Difference between buying and selling volume (if available). A positive delta means buyers dominate; negative means sellers dominate.
ADX (Average Directional Index): Measures trend strength:
Below 20 means weak or no trend;
Above 25 means strong trend;
Between 20-25 is moderate trend.
RSI (Relative Strength Index): Momentum oscillator:
Below 30 = oversold (potential buy);
Above 70 = overbought (potential sell);
Between 40-60 means neutral momentum.
MACD: Confirms momentum direction:
Positive MACD histogram bars indicate bullish momentum;
Negative bars indicate bearish momentum.
Choppiness Index: Measures how much the market is ranging versus trending:
Above 60 = very choppy/sideways market;
Below 40 = trending market.
Consolidation: When true, price is stuck in a narrow range, signaling indecision. Avoid breakout trades during this.
Quick Trading Reminder
Trade only when the trend is clear and volume is above average. Avoid trading in low volume or choppy markets.

Parabolic RSI Strategy [ChartPrime × PineIndicators]This strategy combines the strengths of the Relative Strength Index (RSI) with a Parabolic SAR logic applied directly to RSI values.
Full credit to ChartPrime for the original concept and indicator, licensed under the MPL 2.0.
It provides clear momentum-based trade signals using an innovative method that tracks RSI trend reversals via a customized Parabolic SAR, enhancing traditional oscillator strategies with dynamic trend confirmation.
How It Works
The system overlays a Parabolic SAR on the RSI, detecting trend shifts in RSI itself rather than on price, offering early reversal insight with visual and algorithmic clarity.
Core Components
1. RSI-Based Trend Detection
Calculates RSI using a customizable length (default: 14).
Uses upper and lower thresholds (default: 70/30) for overbought/oversold zones.
2. Parabolic SAR Applied to RSI
A custom Parabolic SAR function tracks momentum within the RSI, not price.
This allows the system to capture RSI trend reversals more responsively.
Configurable SAR parameters: Start, Increment, and Maximum acceleration.
3. Signal Generation
Long Entry: Triggered when the SAR flips below the RSI line.
Short Entry: Triggered when the SAR flips above the RSI line.
Optional RSI filter ensures that:
Long entries only occur above a minimum RSI (e.g. 50).
Short entries only occur below a maximum RSI.
Built-in logic prevents new positions from being opened against trend without prior exit.
Trade Modes & Controls
Choose from:
Long Only
Short Only
Long & Short
Optional setting to reverse positions on opposite signal (instead of waiting for a flat close).
Visual Features
1. RSI Plotting with Thresholds
RSI is displayed in a dedicated pane with overbought/oversold fill zones.
Custom horizontal lines mark threshold boundaries.
2. Parabolic SAR Overlay on RSI
SAR dots color-coded for trend direction.
Visible only when enabled by user input.
3. Entry & Exit Markers
Diamonds: Mark entry points (above for shorts, below for longs).
Crosses: Mark exit points.
Strategy Strengths
Provides early momentum reversal entries without relying on price candles.
Combines oscillator and trend logic without repainting.
Works well in both trending and mean-reverting markets.
Easy to configure with fine-tuned filter options.
Recommended Use Cases
Intraday or swing traders who want to catch RSI-based reversals early.
Traders seeking smoother signals than price-based Parabolic SAR entries.
Users of RSI looking to reduce false positives via trend tracking.
Customization Options
RSI Length and Thresholds.
SAR Start, Increment, and Maximum values.
Trade Direction Mode (Long, Short, Both).
Optional RSI filter and reverse-on-signal settings.
SAR dot color customization.
Conclusion
The Parabolic RSI Strategy is an innovative, non-repainting momentum strategy that enhances RSI-based systems with trend-confirming logic using Parabolic SAR. By applying SAR logic to RSI values, this strategy offers early, visualized, and filtered entries and exits that adapt to market dynamics.
Credit to ChartPrime for the original methodology, published under MPL-2.0.

Dynamic Currency Strength IndexDescription:
This indicator calculates the relative strength of the base currency and quote currency of the currently selected forex pair. Instead of just using a single pair comparison (e.g., GBPUSD - AUDUSD), it determines currency strength using a basket of related pairs, making it more accurate and useful for trading decisions.
How It Works:
Extracts the base and quote currencies from the selected forex pair.
Calculates their individual strengths using multiple related forex pairs.
Displays the strength difference between the base and quote currencies.
How to Use:
✔️ If the strength difference is positive, the base currency is stronger → Bullish signal.
✔️ If the strength difference is negative, the quote currency is stronger → Bearish signal.
✔️ Use it to confirm trends, filter trades, and improve entry timing in forex trading.
💡 Ideal for traders using trend-based strategies (Dow Theory, HH-HL patterns, breakouts, etc.).
